Financial ratios are important, but often overlooked by small business owners. When accurate figures are applied, these calculations are useful to determine a firm’s performance and financial situation. Comparing financial ratios with industry benchmarks can be critical in identifying areas of strength and weakness. In some instances, ratio analysis can even predict future bankruptcy. This list examines ten of the most important financial ratios for your small business.
- Accounts Payable Turnover: This activity ratio shows how quickly a company pays money owed to its suppliers. A ratio of 5 suggests that the firm used and
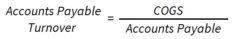 paid off credit five times during the year, or once every 73 days. This ratio increases when more purchases are made or a company decreases its accounts payable. A high ratio means the company is paying off its creditors quickly, and a low ratio indicates vice versa. The seafood business benchmark is 11-18, while breweries is 6.7-7.2.
- Return on Equity: This profitability ratio measures income earned for each dollar invested in the company. It provides an indicator of financial leverage, and
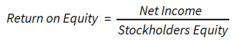 if there are discrepancies with return on assets, the firm may be taking on too much debt. The higher this ratio, the more money a company is generating for shareholders. The air taxi benchmark is 30-34%, while banking is 7.7-8.3%.
- Debt-to-Equity Ratio: This solvency ratio measures the amount of debt a company uses to finance its assets. A ratio of 1.0 indicates the firm uses the same
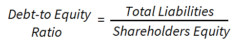 amount of debt as equity, meaning creditors have claim to all assets, leaving nothing for shareholders in the event of liquidation. The greater this ratio, the more debt is being used instead of equity in the business. The hotel benchmark is 6.5-7.1, while commercial fishing is 2.2-2.9.
- Accounts Receivable Turnover: This activity ratio measures how quickly a firm collects its accounts receivable. This evaluates the company’s ability to issue
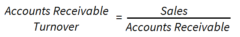 credit to its customers and collect from them. A high ratio means the company is efficient in collecting its bills and has trustworthy clients, while lower ratios can lead to accounts unnecessarily tying up working capital. The bakery benchmark is 24-51, while insurance carriers is 4.6-6.6.
- Current Ratio: This liquidity ratio indicates how well a company can pay its bills. If the ratio is more than 1.0, the firm has more short term assets than short
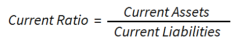 term liabilities. A ratio less than 1.0 means the company could be vulnerable in the economy. However, a current ratio that is high may indicate the company is carrying too much inventory or not making enough sales. The grocery store benchmark is 4.5-4.8, while oil and gas is 2.4-2.6.
- Return on Assets: This profitability ratio is used to determine how effectively a firm’s assets are being used to generate profits. The higher this ratio, the
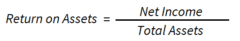 better a company is using its assets to make money. There are no ceilings for this ratio, unlike the current ratio, where high numbers could mean an underlying problem. The medical offices benchmark is 55-60%, while logging is 10-15%.
- Net Profit Margin: This profitability ratio shows a firm’s ability to convert sales into earnings for the company. It determines a company’s overall profitability
 and performance, taking into account profit and overhead expenses. A net profit margin of 10% indicates that for every dollar of revenue generated by the firm, $0.10 was created for shareholders. The real estate business benchmark is 14-15%, while furniture stores is 2-3%.
- Inventory Turnover: This activity ratio shows how quickly the company is selling their products. A higher ratio means sales are good and the firm is more
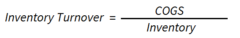 effectively managing its inventory, resulting in less company resources tied up in inventory. However, an unusually high ratio can be a sign that inventory is too lean, and the company may not be able to keep up with demand. In industries with perishable goods, buyers should seek sellers with the highest inventory turnover. The dairy industry benchmark is 6.6-7.1, while used car dealers is 4.2-4.4.
- Quick Ratio: This liquidity ratio is important in that it determines a firm’s ability to generate cash. Similar to the current ratio, a result of less than 1.0
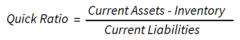 indicates the company cannot cover its short term debts with cash, securities, and accounts receivable. A ratio greater than 1.0 is a good indicator that the firm is doing well. The gasoline station benchmark is 5.6-6.0, while housing contractors is 1.1-1.3.
- Gross Profit Margin: This profitability ratio is arguably one of the most used and is important in determining pricing with product costs. A gross profit
 margin of 50% shows that half of the revenues generated by the business are used to pay for cost of goods sold. Firms with a higher result will typically have a competitive advantage over others in their industry, since they are able to charge more for their product. The vegetable farming benchmark is 60-65%, while mining is 25-35%.
Now that you’ve reached the end of the list, you may be disappointed to learn that no single financial ratio is the “tell-all” for your small business. When conducting a ratio analysis, be sure to compare several different ratios to industry benchmarks for a better understanding on the health of your firm.
Industry benchmarks in this article were taken from ProfitCents, a financial analysis tool available at no-cost through the Alaska Small Business Development Center.
 Written by Cliff Cochran, Business Advisor